The Climate Crisis – A Factfulness Quiz
(Questions, answers & comments)
1. Prologue
Comment: “The following short quiz requires knowledge of fundamental facts, predictions, and expert opinions regarding anthropogenic (human-caused) global warming. The questions were inspired by Professor Hans Rosling’s Factfulness Quiz on global health. He used to educate his students, but also the rest of society, especially decision-makers, on global health, but also on their pre-conceptions and biases using a quiz format. Thereby, he also demonstrated the need for continued education to make the right decisions in a fast-changing world. Since climate change, also referred to as climate emergency, is considered the decisive question of our time, factfulness on this vital topic is strongly needed.
2. Quiz
2.1 Question 1 – Current carbon dioxide levels
Comment Q: “In the context of global warming, the so far most important greenhouse gas is “Carbon Dioxide”, CO2, or often shortly referred to as “Carbon”. Therefore, it is important to know what the current concentration of carbon dioxide in the Earth’s atmosphere is at present, for example, in May 2019: [Read Question]”
| Q1 | What was the average concentration of carbon dioxide [in parts per million, ppm] in the Earth’s atmosphere in May 2019? Note: The measurement was taken at the Mauna Loa measurement station on Hawaii. Seasonal changes lead to decrease (around 6 ppm) of carbon dioxide concentration after May each year due to plant growth in the Northern Hemisphere. |
|---|---|
| A) 215 ppm B) 415 ppm (correct) C) 615 ppm D) 815 ppm |
|
| References | Dr. Pieter Tans, NOAA/ESRL and Dr. Ralph Keeling, Scripps Institution of Oceanography (2019-06-23). Trends in Atmospheric Carbon Dioxide [Website, Data]. Website: https://www.esrl.noaa.gov/gmd/ccgg/trends/data.html, Dataset: ftp://aftp.cmdl.noaa.gov/products/trends/co2/co2_mm_mlo.txt |
Comment A: “The correct reply is 415 parts per million, a concentration which was never so high in the history of humans, in fact, at least the last 800,000 years.”
2.2 Question 2 – Safe carbon dioxide levels
Comment Q: “To put this value into context, the next questions is about the carbon dioxide concentration which is considered “safe” based on the natural history of natural and human life on planet Earth: [Read Question]”
| Q2 | What average concentration of carbon dioxide [in parts per million, ppm] in the Earth's atmosphere is considered "safe"? |
|---|---|
| A) 150 ppm B) 350 ppm (correct) C) 550 ppm D) 750 ppm |
|
| References | Hansen, J., M. Sato, P. Kharecha, D. Beerling, R. Berner, V. Masson-Delmotte, M. Pagani, M. Raymo, D.L. Royer, and J.C. Zachos, 2008: Target atmospheric CO2: Where should humanity aim? Open Atmos. Sci. J., 2, 217-231, doi:10.2174/1874282300802010217. URL: https://arxiv.org/abs/0804.1126 |
Comment A: “Hansen et al (2008) derived a safe threshold of 350 parts per million in their paper. This value was considered so crucial that actually an environmental organisation which focuses on the climate crisis was named after that, ie “350.org”. However, at present the current carbon dioxide concentration (even after adjusting for seasonal changes) is dramatically higher at around 415 ppm.”
2.3 Question 3 – Future carbon dioxide levels
Comment Q: “Therefore, the current development of the climate is not safe anymore, and one may wonder why humankind has not taken action, maybe because of a lack of scientific knowledge? The next question refers to the predictions of carbon dioxide concentrations in 2019 based on analysis which were performed by the fossil-fuel company EXXON back in 1982: [Read Question]”
| Q3 | What level of carbon dioxide concentration [in parts per million, ppm] in 2019 did the fossil-fuel company EXXON predict back in 1982? Note: The carbon dioxide level according to Scripps CO2 measurements at Mauna Loa (cf Keeling curve) was 415 ppm in May 2019. |
|---|---|
| A) 120 ppm B) 320 ppm C) 420 ppm (correct) D) 620 ppm |
|
| References | Exxon/Coordination and Planning Division (1982-04-01). C02 Greenhouse Effect – A technical Review (EC-11-5/A3), Retrieved 2019-06-18 from https://bit.ly/2WOwEG4. see also: Hall, S. (2015-10-26). Exxon Knew about Climate Change almost 40 years ago. Scientific American. Available at https://www.scientificamerican.com/article/exxon-knew-about-climate-change-almost-40-years-ago/ |
Comment A: “EXXON predicted already in 1982 that carbon dioxide levels in 2019 would be around 420 ppm, in comparison to the actual current level of 415ppm in May 2019. Considering that EXXON has no self-interest in overestimating carbon concentrations or global warming and the selected predictions back in 1982 are impressively precise, these results indicate the scientific quality of EXXON’s in-house research, but also that science can actually predict important climate variables with high precision. However, this report which could have been used to inform politics and society was not published until 2015.”
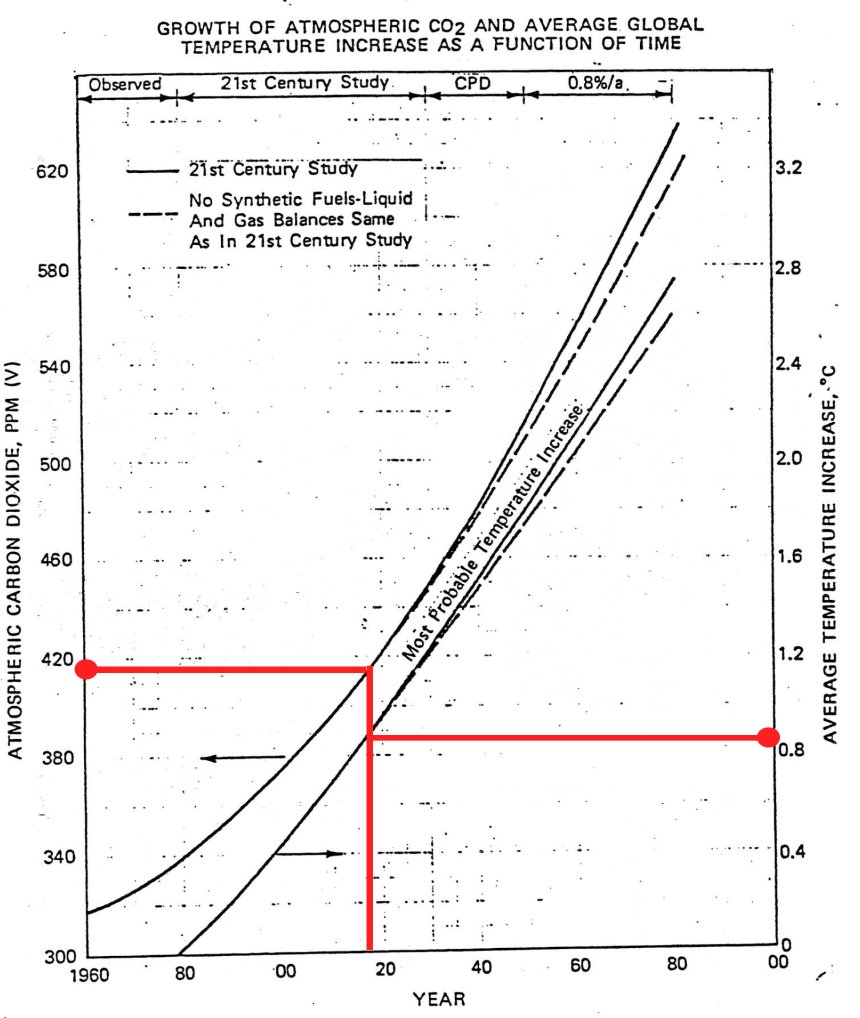
Figure 3: Growth of atmospheric CO2 and average of global temperature increase as a function of time (Exxon/Coordination and Planning Division (1982-04-01). C02 Greenhouse Effect – A technical Review (EC-11-5/A3), Retrieved 2019-06-18 from https://bit.ly/2WOwEG4. Original Figure 3 with annotation from Der Spiegel, 2019-05-17, https://bit.ly/2EAhOwT)
2.4 Question 4 – Current temperature increase
Comment Q: “The increase of carbon dioxide in the atmosphere itself is not toxic, however, by affecting radiative forcing or the energy balance of energy kept on Earth versus reflected back into space, it leads to an increase of the global mean surface temperature. Therefore, the next question is about the global mean surface temperature increase in 2018 relative to the pre-industrial age, ie between 1880 to 1900: [Read Question]”
| Q4 | What was the global mean surface temperature increase [in ° Celsius relative to the pre-industrial age, here: average from 1880 to 1900] in 2018? |
|---|---|
| A) 0.5° Celsius B) 1.0° Celsius (correct) C) 1.5° Celsius D) 2.0° Celsius |
|
| References | NOAA National Centers for Environmental Information, State of the Climate: Global Climate Report for Annual 2018, published online January 2019, retrieved on June 23, 2019 from https://www.ncdc.noaa.gov/sotc/global/201813. |
Comment A: “The global mean surface temperature in 2018 has already increased to 1.0°C relative to the pre-industrial age. However, to properly understand the implications of this, I would like to add that science has focused on predicting means and medians because they are more reliable to predict than single, extreme observations. One has to be aware that it is not the averages but the extremes which pose the real threat to natural and human life. For example, 12 months with a constant temperature of 30°C may perceived as pleasant. 12 months with 10 months of constant 30°C, one month with 60°C, and one month with 0°C, which means the same average temperature per year, may be an immense health risk or, in fact, deadly, to many species, which are often adjusted to narrow temperature zones. Therefore, it is the extremes, not the averages, which are killing life.”
2.5 Question 5 – Safe temperature increase
Comment Q: “To put the current global mean surface temperature increase into perspective, based on the natural history of humankind a safe global mean surface temperature can be derived: [Read Question]”
| Q5 | What is the global mean surface temperature increase [in ° Celsius relative to the pre-industrial age, here: average from 1850 to 1900] which is considered "safe" based on natural history? |
|---|---|
| A) 0.5° Celsius B) 1.0° Celsius C) 1.5° Celsius (correct) D) 2.0° Celsius |
|
| References | IPCC, 2018: Summary for Policymakers. In: Global warming of 1.5°C. An IPCC Special Report on the impacts of global warming of 1.5°C above pre-industrial levels and related global greenhouse gas emission pathways, in the context of strengthening the global response to the threat of climate change, sustainable development, and efforts to eradicate poverty [V. Masson-Delmotte, P. Zhai, H. O. Pörtner, D. Roberts, J. Skea, P.R. Shukla, A. Pirani, W. Moufouma-Okia, C. Péan, R. Pidcock, S. Connors, J. B. R. Matthews, Y. Chen, X. Zhou, M. I. Gomis, E. Lonnoy, T. Maycock, M. Tignor, T. Waterfield (eds.)]. World Meteorological Organization, Geneva, Switzerland, 32 pp. URL: https://www.ipcc.ch/sr15/chapter/summary-for-policy-makers/ Schellnhuber, HJ (2015). Selbstverbrennung (p. 453). Bertelsmann. |
Comment A: “Schellnhuber (2015), who is a leading climate scientist, had a key role in deriving the “safe” 1.5°C and the “controllable” 2°C target of the Paris Climate Agreement. He argued that 1.5°C of global warming is within the temperature range which natural and human life was exposed to in the past, and, therefore, could be considered as “safe”. In addition, he argued that one may even add some more variation of 0.5°C to the already observed natural temperature range and still may be able to limit the consequences of global warming to a range which is controllable by human civilization. Hence, the 1.5°C and 2°C targets were used in the Paris Climate Agreement.”
2.6 Question 6 – Future temperature increase
Comment Q: “With this in mind, we have to be aware that because of the emitted greenhouse gases with some time lag, the global mean surface temperature will also increase in the future. To support communication, the year 2100 was chosen as a landmark timepoint to base predictions of future global warming on. So an important question is …: [Read Question]”
| Q6 | What global mean surface temperature increase [in ° Celsius relative to the pre-industrial age, here: average from 1850 to 1900] is expected until 2100 under current policies? Note: The estimated value is the median (50% quantile, ie with 50% lower values). The lower limit is the 16.0% quantile and the upper limit the 82.5% quantile, resulting in an approximate 67% confidence interval. |
|---|---|
| A) 1.5° Celsius [Range: 0.5, 2.5] B) 2.1° Celsius [Range: 0.9. 3.3] C) 3.3° Celsius [Range: 2.5, 4.4] (correct) D) 5.2° Celsius [Range: 4.1, 6.3] |
|
| References | ClimateActionTracker (2018-12). WARMING PROJECTIONS GLOBAL UPDATE, Retrieved 2019-06-12, from https://climateactiontracker.org/publications/warming-projections-global-update-dec-2018/ Mastrandrea, M.D. et al (2010-06-07). Guidance Note for Lead Authors of the IPCC Fifth Assessment Report on Consistent Treatment of Uncertainties. https://wg1.ipcc.ch/SR/documents/ar5_uncertainty-guidance-note.pdf Geiges, A. (2019-07-09). Re: Warming Projections Global Update, Dec 2018: Statistics [Personal Communication via Email]. |
Comment A: “The global mean surface temperature will increase by a median of 3.3°C with an approximate 67% confidence interval between 2.5°C and 4.4°C. This means, under current estimations the future global mean surface temperature remains between 2.5°C and 4.4°C until year 2100 with an approximate 67% probability. This also means that there is also a 33% chance that we experience smaller or larger temperature increases outside this uncertainty interval. Since uncertainty may not be your friend, a temperature increase above 4.4°C is absolutely possible.”
2.7 Question 7 – Effect on human population
Comment Q: “While the increase of concentration of greenhouse gases, especially carbon dioxide, is the cause, the increase of the global mean temperature may be seen as a mediator, which carries forward these effects, ultimately changing the climate, ie the distribution of temperature, air, and water, in all its forms. These effects will finally affect the ultimate endpoint, which is human civilization. Therefore, the next question is …: [Read Question]”
| Q7 | What is the maximum number of humans, who can live on "Hothouse Earth" (ie the Earth after global warming > 4° Celsius)? Note: Today’s population is 7.6 billion. |
|---|---|
| A) 12 billion people (12 000 000 000) B) 8 billion people (8 000 000 000) C) 4 billion people (4 000 000 000) D) 1 billion people (1 000 000 000) (correct) |
|
| References | Schellnhuber, HJ (2015). Selbstverbrennung. Bertelsmann, p. 507. Steffen, W. (2019-03-16). Climate Change 2019: Rising Risks; Growing Challenges. Uppsala University, Retrieved 2019-05-21 from https://bit.ly/2Isb0Ue . Rees, W. E. (2019-09-18). Yes, the Climate Crisis May Wipe out Six Billion People. The Tyee Online Magazine. URL: https://thetyee.ca/Analysis/2019/09/18/Climate-Crisis-Wipe-Out/ NEP Global Environmental Alert Service (GEAS) (2012). One Planet, How Many People? A Review of Earth’s Carrying Capacity - A discussion paper for the year of RIO+20. URL: https://na.unep.net/geas/archive/pdfs/geas_jun_12_carrying_capacity.pdf McKinsey Global Institute (January 2020). Climate risk and response - physical hazards and socioeconomic impacts. ("Livability and workability", p. 98), https://mck.co/2ZuSYcV |
Comment A: “In fact, Professor Hans-Joachim Schellnhuber provided an educated “guess-timate” of the maximum carrying capacity of 1 billion (1 000 000 000) humans under un-controlled global warming at a plenary talk at COP15 in Copenhagen in 2009 (Schellnhuber, 2015, p. 507). Professor William Steffen, a leading climate scientist and senior research fellow at the Stockholm Resilience Centre, also used Schellnhuber’s estimate for the maximum carrying capacity of “hothouse earth” at a recent presentation at Uppsala University on March 16, 2019. However, at present 7.6 billion people are living on planet Earth. Even if these estimates of the maximum carrying capacity are way off and the actual number is 5 billions, it still indicates an existential crisis for future generations.”
2.8 Question 8 – Average carbon dioxide emissions per person per year
Comment Q: “After we looked at the climate crisis from a global perspective, I would like to break it down to the individual level: [Read Question]”
| Q8 | What is the average amount of carbon dioxide emissions [in tons of carbon dioxide equivalents, tons CO2e, per person per year] in Sweden (as of 2016)? Note: Sweden can be regarded as an example of a highly-industrialized, European country. |
|---|---|
| A) 1.0 tons CO2e B) 2.3 tons CO2e C) 10.1 tons CO2e (correct) D) 20.4 tons CO2e |
|
| References | Naturvardsverket (2018-11-28) . Konsumtionsbaserade växthusgasutsläpp per person och år. URL: https://www.naturvardsverket.se/Sa-mar-miljon/Statistik-A-O/Vaxthusgaser-konsumtionsbaserade-utslapp-per-person/ |
Comment A: “A person living in Sweden emitted in the year 2016 around 10.1 tons CO2e of greenhouse gases on average.”
2.9 Question 9 – Sustainable carbon dioxide emissions per person per year
Comment Q: “Considering that we only have a certain global budget of carbon dioxide left, which we can emit, without global warming of 2 degrees Celsius or more, the question now is, how much carbon dioxide are we allowed to emit. Let’s ignore any aspects of historical carbon emissions and climate justice, but let’s just assume that the remaining carbon budget is split equally between the expected number of people living until we have to reach net carbon emissions of zero in 2050: [Read Question]”
| Q9 | What is the sustainable carbon dioxide budget [in tons of carbon dioxide equivalents, tons CO2e, per person per year] to limit global warming to a "controllable" zone of up to 2° Celsius? Note: Assuming global net zero carbon emissions till 2050 with an average human population of 8.2 billion individuals and peak carbon emissions in 2015. |
|---|---|
| A) 0.5 tons CO2e B) 2.3 tons CO2e (correct) C) 10.1 tons CO2e D) 20.4 tons CO2e |
|
| References | Atmosfair (2019-05-21) The Annual Climate Budget. Retrieved 2019-05-21, from https://www.atmosfair.de/en/green_travel/annual_climate_budget/ based on German Advisory Council on Global Change (WBGU), 2009. Special Report. URL: https://www.wbgu.de/en/publications/publication/solving-the-climate-dilemma-the-budget-approach |
Comment A: “The sustainable amount of greenhouse gas emissions is actually 2.3 tons CO2e per person per year world-wide, which is about a factor 4 lower than current individual annual emissions in Sweden. Unfortunately, the assumptions of these calculations are already outdated because carbon emissions have not peaked in 2015, but reached a maximum value in 2018 without signs of slowing down. This means, the personal annual carbon budget has already decreased substantially.”
2.10 Question 10 – Emission of greenhouse gases by diet
Comment Q: “Food and the required agriculture to produce these foods have a major impact on the climate. The next question, therefore, is …: [Read Question]”
| Q10 | How much does the emission of greenhouse gases [in percent per person per year] change by following a vegetarian diet in comparison to a current average Western diet? Note: A vegetarian diet does not contain any animal meat. The median change of greenhouse gas emissions is reported here in reference to average Western population-level food intakes (and corresponding greenhouse gas emissions). |
|---|---|
| A) +45% B) +31% C) 0 % D) -31% (correct) E) -45% |
|
| References | Aleksandrowicz, L., Green, R., Joy, E. J., Smith, P., & Haines, A. (2016). The Impacts of Dietary Change on Greenhouse Gas Emissions, Land Use, Water Use, and Health: A Systematic Review. PloS one, 11(11), e0165797. doi:10.1371/journal.pone.0165797 Wynes, S., & Nicholas, K. A. (2017). The climate mitigation gap: education and government recommendations miss the most effective individual actions. Environmental Research Letters, 12(7), 074024. https://doi.org/10.1088/1748-9326/aa7541 |
Comment A: “According to a study by Aleksandrowicz et al (2016), greenhouse gas emissions can be reduced by a median of 31% by switching from a conventional to a vegetarian diet. A purely vegan diet would even reduce these emissions by a median of 45%. Assuming that 30% of anthropogenic greenhouse gas (GHG) emissions stem from agriculture, a vegetarian diet would reduce carbon emissions of the average Swede by -31% * 30% * 10.1 tons/(person* year)= 1 tons/(person*year), which is inline with the results by Wynes & Nicholas (2017).”
2.11 Question 11 – Emission of greenhouse gases by air travel
Comment Q: “In addition to diet, air travel is a strong contributor to the individual carbon footprint. As an example, let’s look at a typical transatlantic flight from London to New York and back and its impact on the climate: [Read Question]”
| Q11 | How much carbon dioxide emissions [in tons of carbon dioxide equivalents, tons CO2e] does a flight London-New York-London correspond to? |
|---|---|
| A) 11.7 tons CO2e B) 6.2 tons C02e C) 3.4 tons CO2e (correct) D) 0.1 tons CO2e |
|
| Reference | Atmosfair (2019-05-21). Calculate Flight Emissions. Retrieved 2019-05-21, from https://www.atmosfair.de/en/offset/flight |
Comment A: “A return flight London – New York – London corresponds to emitting about 3.4 tons of CO2e. Putting this into perspective, a person can emit more greenhouse gases during two 8-hour flights than the person is allowed to emit in one year while limiting global warming to the 2 degree target.”
2.12 Question 12 – Past action on carbon dioxide emissions
Comment Q: “Let’s now switch back again, to the global perspective on the climate crisis and the political process dealing with it. In 1996, the first Conference of the Parties within the UN Framework Convention on Climate Change was held in Berlin, Germany. In 2014, the 20th COP meeting was held in Lima, Peru: [Read Question]”
| Q12 | How have global carbon emissions per year changed from 1996 (COP1) to 2014 (COP20) [in percent]? Note: The Conference of the Parties (COP) within the United Nations Framework Convention on Climate Change (UNFCCC) is the most important international conference and political forum on climate change and takes place once per year. |
|---|---|
| A) -53% B) -23% C) 0% D) +23% E) +53% (correct) |
|
| Reference | World Bank (2019-06-17). Data, CO2 emissions (kt) [EXCEL file]. Retrieved 2019-06-17 from https://data.worldbank.org/indicator/EN.ATM.CO2E.KT |
Comment A: “Although 20 meetings over 20 years were held, the carbon dioxide emissions have actually increased by 53%, instead of decreased, which shows that the global development is going in the completely wrong direction in comparison to the action required to stop climate change. ”
2.13 Question 13 – Required action on carbon dioxide emissions
Comment Q: “We may now wonder, where are we at this point, and what action is required to meet the 1.5 degree Celsius target: [Read Question]”
| Q13 | How much do global carbon emissions have to decrease [in percent] from levels in year 2010 until year 2030 to limit global warming to a "safe" global mean temperature increase of 1.5° Celsius until year 2100? |
|---|---|
| A) 0% B) -15% C) -45% (correct) D) -100% |
|
| References | IPCC, 2018: Global warming of 1.5°C. An IPCC Special Report on the impacts of global warming of 1.5°C above pre-industrial levels and related global greenhouse gas emission pathways, in the context of strengthening the global response to the threat of climate change, sustainable development, and efforts to eradicate poverty [In Press]. Retrieved 2019-06-23 from https://www.ipcc.ch/sr15/. Details on citation: Chapter 2, p. 95 Andrews, R. (2019-04-23) . It's getting harder and harder to limit ourselves to 2°C [Website]. Retrieved 2019-06-23 from http://folk.uio.no/roberan/t/global_mitigation_curves.shtml. |
Comment A: “According to the last IPCC report (2018), humankind has to reduce carbon dioxide emissions by 45% (relative to 2010) until 2030 to have a 67% chance to limit global warming to 1.5 degrees. Considering that humankind is living in a fossil-fuel based economy, a time frame of 12 years or less is an incredibly short time, which makes it seem almost impossible, at least regarding an international solution. Just to put this into perspective, it took 19 years from the COP1 conference in 1996, Berlin, to the Paris Climate Agreement in 2015, and 22 years to agree a rule book on the implementation of the Paris Climate Agreement at COP24 in 2018, Katowice.”
3. Epilogue
3.1 The total failure of global mitigation of climate change
Comment: “After having answered these core questions on the climate crisis, I hope, it becomes apparent, why climate change should actually be referred to as climate crisis or climate emergency. There is a hard to bear discrepancy, between what needs to be done and what has been done, and, unfortunately now also, what can be done. The following Keeling curve has been annotated by major climate-relevant events over the last 60 years. Independent of major political decisions or public attention, the concentration of carbon dioxide has been rising linearly, if not exponentially, without any signs of slowing down.”
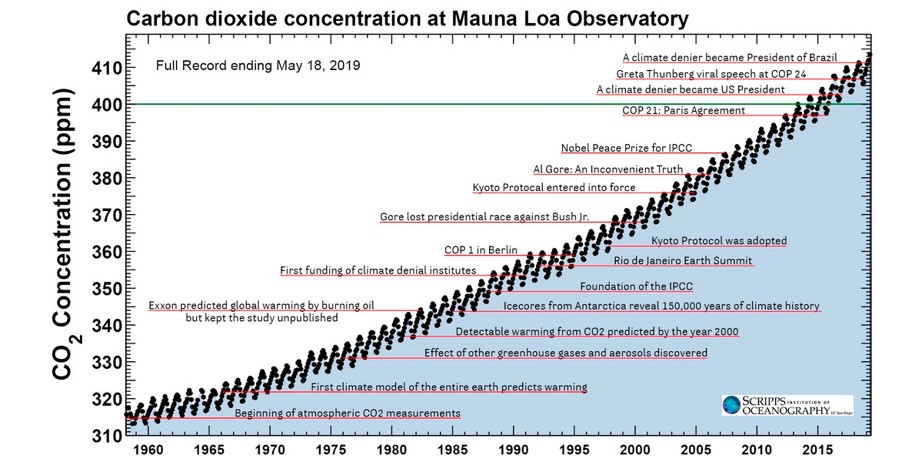
Figure 3.1: The Keeling curve from 1958 until 2019 annotated with climate-relevant events (from Flammer, M. (2019-05-21). https://bit.ly/2ZsGz5Z)
3.2 Limiting global warming to 1.5°C no longer realistic, 2°C requires massive action
Comment: “The climate researcher Robbie Andrew has illustrated the carbon curve, which would be required to have a 67% chance to mitigate climate change to “safe” 1.5°C or “controllable” 2°C degrees assuming peak carbon emissions around 2020, ie now. Since the 1.5°C target would require such a massive reduction of carbon emissions, which is impossible in reality, the target can only be reached by technologies allowing large negative emissions. Unfortunately, these technologies do not exist yet on the required industrial scale.
To have a 67% chance to limit climate change to the 2°C target, one would only require a 25% reduction of carbon emissions until 2030. However, in my opinion this would require massive action on all levels of society, which has no equivalent in human history. The only historical example, which seems on the same scale is the mobilization, which happened during the second world war.”
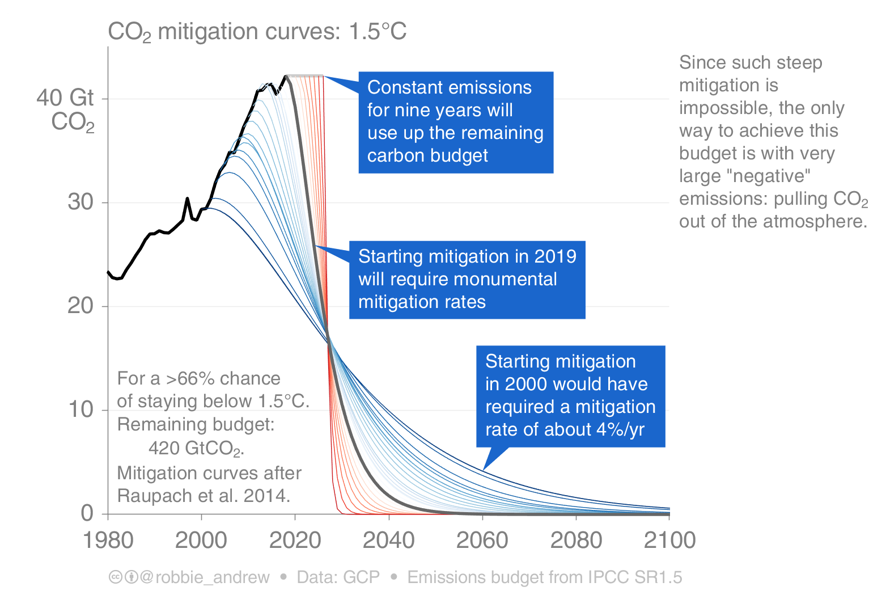
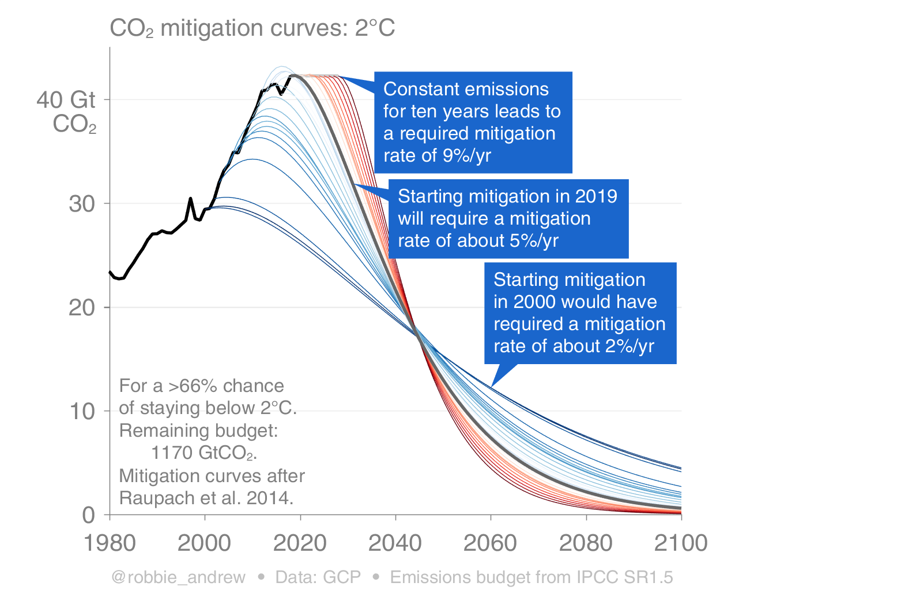
Figure 3.2: Hypothetical carbon dioxide curves over time showing climate change mitigation scenarios (from Andrew, R. (23 April 2019). It’s getting harder and harder to limit ourselves to 2°C. Retrieved 2019-06-18 from http://folk.uio.no/roberan/t/global_mitigation_curves.shtml)
See also reference: Raupach, Michael R.; Davis, Steven J.; Peters, Glen P.; Andrew, Robbie M.; Canadell, Josep G.; Ciais, Philippe; Friedlingstein, Pierre; Jotzo, Frank; Vuuren, Detlef P. van (21 September 2014). “Sharing a quota on cumulative carbon emissions”. Nature Climate Change. 4 (10): 873–879. doi:10.1038/nclimate2384. ISSN 1758-6798.
3.3 The Climate Crisis – A direct existential threat
Comment: “To summarize the situation, which humankind faces, I would like to quote United Nations Secretary-General António Guterres:
“Climate change is the defining issue of our time – and we are at a defining moment.
We face a direct existential threat.”United Nations Secretary-General António Guterres, 2018-09-10,
retrieved 2019-06-18 from https://www.un.org/sg/en/content/sg/statement/2018-09-10/secretary-generals-remarks-climate-change-delivered
Therefore, urgent, massive action is needed of all individuals to limit global warming to a “controllable” level.
Everybody is welcome! Everybody is needed!”
4. Further Reading
- IPCC, 2018: Global warming of 1.5°C. An IPCC Special Report on the impacts of global warming of 1.5°C above pre-industrial levels and related global greenhouse gas emission pathways, in the context of strengthening the global response to the threat of climate change, sustainable development, and efforts to eradicate poverty [V. Masson-Delmotte, P. Zhai, H. O. Pörtner, D. Roberts, J. Skea, P.R. Shukla, A. Pirani, W. Moufouma-Okia, C. Péan, R. Pidcock, S. Connors, J. B. R. Matthews, Y. Chen, X. Zhou, M. I. Gomis, E. Lonnoy, T. Maycock, M. Tignor, T. Waterfield (eds.)]. In Press. URL: https://www.ipcc.ch/sr15/
- Steffen, W., Rockström, J., Richardson, K., Lenton, T. M., Folke, C., Liverman, D., … Schellnhuber, H. J. (2018). Trajectories of the Earth System in the Anthropocene. Proceedings of the National Academy of Sciences, 115(33), 8252–8259. https://doi.org/10.1073/pnas.1810141115
- Steffen, W., Richardson, K., Rockström, J., Cornell, S. E., Fetzer, I., Bennett, E. M., … Sörlin, S. (2015). Sustainability. Planetary boundaries: guiding human development on a changing planet. Science (New York, N.Y.), 347(6223), 1259855. https://doi.org/10.1126/science.1259855
- Ceballos, G., Ehrlich, P. R., & Dirzo, R. (2017). Biological annihilation via the ongoing sixth mass extinction signaled by vertebrate population losses and declines. Proceedings of the National Academy of Sciences, 114(30), E6089–E6096. https://doi.org/10.1073/pnas.1704949114